ちなみに311とマントルの粘弾性緩和は別に大して新しい話でもない
http://www.huffingtonpost.jp/science-portal/diastrophism_b_5871018.html
東日本大震災後の地殻変動の要因を解明
投稿日: 2014年09月24日 15時46分 JST 更新: 2014年11月23日 19時12分 JST
シェア
15
ツイート
コメント
0
印刷
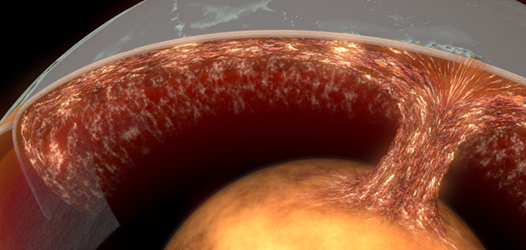
東日本大震災後の大きな地殻変動は誰もが気にしている。その研究で重要な成果が出た。2011年東北地方太平洋沖地震の発生後に継続して進行している地殻変動の要因として、「粘弾性緩和」という過程が重要な役割を果たしていることを、東北大学の災害科学国際研究所の日野亮太教授と大学院理学研究科の三浦哲(さとし)教授らが突き止めた。カナダ地質調査所(ビクトリア大学兼任)のケリン・ワン教授らとの共同研究で、9月18日付の英科学誌ネイチャーのオンライン版に発表した。
粘弾性緩和とは、震源域下深部のマントルが粘性をもつために、地震時変動の影響が時間の遅れを伴って発現し、地震に伴う応力変化を徐々に小さくする現象をいう。震源域の海底における地殻変動観測と、その観測結果に基づく数値シミュレーションに基づいて、この地殻変動の要因を解明することに成功した。この成果で、2011年の大地震の震源となったプレート境界断層の動きをより正確に把握することが可能となり、今後の大地震発生の予測にも貢献することが期待されている。 東日本大震災をもたらした2011年東北地方太平洋沖地震は、太平洋プレートの沈み込みによって蓄えられたひずみエネルギーを解放するために、プレートの境界面を断層面として巨大なすべりが起こって発生した。このマグニチュード9.0の巨大地震発生後、大規模な地殻変動が東北地方と太平洋海域で継続して観測されている。 こうした地震後地殻変動には、2011年の地震ですべったプレート境界面が再び固着を回復し、次の大地震の発生に向けてひずみエネルギーの蓄積が再開される過程が反映されているため、多くの研究者が注目している。研究グループは、大地震の震源の直上に位置する海域で海底地殻変動を観測し、その解析に基づいて解析した。 2011年3月の地震発生時に31mの東南東方向の水平変動が観測された震源域の海底で、地震発生後の2011年8月、10月、12年7月に観測を実施し、基準点が地震後ほぼ一定の速度で西北西の方向に移動している様子を捉えた。これは、地震時変動による移動方向(東南東方向)と全く逆向きで、陸上で観測されている地震後の地殻変動が地震時と同様に東南東方向なのと大きく違っていた。 数値シミュレーションで計算した結果、2011年の地震時変動によるマントルの粘弾性緩和で想定される地表面変形のパターンと符合し、実際に観測された地震後地殻変動をよく説明できた。粘弾性緩和の影響が時間とともに小さくなることも、観測されるデータを数値シミュレーションして再現できた。「マントルの粘弾性緩和の影響が地震後地殻変動の主因となるのは地震発生後数十年が経過した後」とされてきた従来の考え方を覆し、地殻の下にあるマントルの粘弾性緩和の影響を無視できないことを示した。 研究グループを率いる日野亮太教授は「2011年東北地方太平洋沖地震は規模が大きかったので、マントルの粘性によって応力が徐々に小さくなっていく粘弾性緩和の影響がすぐ直後に出ているといえる。あれだけ巨大な地震が起きて、行く末がどうなるか、誰もが関心を持っている。最も重要な情報源は地殻変動で、その物理的な解明がこれで一歩進んだ。巨大地震震源域の地殻変動の監視と理論は重要で、次の大地震の予測にも貢献するだろう」と話している。 2011年東北地方太平洋沖地震に伴う地殻変動。左は 地震時の変動。右は 地震後1年間の変動。赤矢印は観測された水平変動ベクトル、黒矢印はモデルから予測された値。陸上の観測は国土地理院、GJT3以外の海底観測は海上保安庁による。
図1. 2011年東北地方太平洋沖地震に伴う地殻変動。左は 地震時の変動。右は 地震後1年間の変動。赤矢印は観測された水平変動ベクトル、黒矢印はモデルから予測された値。陸上の観測は国土地理院、GJT3以外の海底観測は海上保安庁による。 2011年東北地方太平洋沖地震後の地殻変動のシミュレーションに用いた地下構造モデル。地表の赤色シンボルは地殻変動の評価を行った観測地点。
図2. 2011年東北地方太平洋沖地震後の地殻変動のシミュレーションに用いた地下構造モデル。
地表の赤色シンボルは地殻変動の評価を行った観測地点。 地震後地殻変動の時間変化の例。上のaは海底の4観測点、下のbは 陸上の4観測点。赤シンボルあるいは赤実線観測値、黒実線がシミュレーションによる予測値。各観測点の位置は、図1bに緑丸印で示されている。
グラフ. 地震後地殻変動の時間変化の例。上のaは海底の4観測点、下のbは 陸上の4観測点。赤シンボルあるいは赤実線観測値、黒実線がシミュレーションによる予測値。各観測点の位置は、図1bに緑丸印で示されている。
(いずれも提供:東北大学) 関連リンク
・東北大学 プレスリリース
http://www.tohoku.ac.jp/japanese/2014/09/press20140917-01.html
http://www.tohoku.ac.jp/japanese/newimg/pressimg/tohokuuniv-press_20140917_01web.pdf http://scienceportal.jp/news/newsflash_review/newsflash/2014/09/20140919_02.html もっと見る: 東北地方太平洋沖地震 震災 プレート ケリン・ワン 三浦哲 マントル 社会 地殻変動 3.11 東日本大震災 太平洋プレート 数値シミュレーション 日野亮太 科学誌ネイチャー 粘弾性緩和
http://www.geod.jpn.org/web-text/part3_2014/tanaka/
粘弾性変形の理論とその進展
東京大学地震研究所 田中愛幸
1. 粘弾性の基礎
弾性とは, 加えられた力に比例して変形(伸びや縮み)が生じ, 力を取り除くと元の形に戻る性質のことをいう. 粘性とは, 力を加えている間は変形が増大し, 力を取り除いても元に戻らないような性質をいう. 両者を合わせた性質を粘弾性という.
一次元的な固体を考えて, ττを応力, xxを伸び(変位), kkを弾性定数(Pa), μμを粘性(Pa s)とすると, 弾性はフックの法則(τ=kxτ=kx), 粘性はニュートンの法則(τ=μdx/dtτ=μdx/dt)で記述できる. 弾性はバネ, 粘性はダッシュポットに対応していると考えればよい. これらを直列につないだものをマックスウェルの粘弾性モデルと呼ぶ(図1). 時刻t=0t=0に時間変化しない一定の変位を与えると, バネはt=0t=0で瞬時に伸びるが, ダッシュポットの変位量はゼロである. t>0では, バネに蓄えられた弾性エネルギーがダッシュポットの変位によって消費され, バネの伸びがゼロになるまでダッシュポットの変位が継続する. これを応力緩和という. ダッシュポットの変位量は1-exp(-(k/μ)t)1-exp(-(k/μ)t)に比例し, μ/kμ/kは緩和時間と呼ばれる. 図1. マックスウェルの粘弾性モデル 2. マントルの粘弾性とポストグレイシャルリバウンド
マントル対流という用語があるように, 非常に長い時間スケール(例えば数千万年)では, マントルは粘性流体のように振る舞う. 一方, マントル中を地震波が伝わることから明らかなように, 短い時間スケール(例えば数時間)ではマントルは弾性体として振る舞う. それでは, その間の時間スケールでは, マントルは粘弾性的性質を示すのだろうか? スカンジナビア半島や北米大陸等に大規模な氷床が存在したことが知られている. これらの地域では, 年間1 cm以上の隆起が発生していることが測地観測によって捉えられている(Sella et al. 2007). この現象はポストグレイシャルリバウンド(Post Glacial Rebound或いはグレイシャルアイソスタティックアジャストメントGlacial Isostatic Adjustment)と呼ばれ, 粘弾性変形の理論で説明することができる. 地球表層に存在した氷の荷重によってマントルにまで及んでいた(弾性体としての)地殻の凹みが, 氷床が消失した今も少しずつ回復してきている. 氷床の時空間分布を入力とする粘弾性変形モデルを構築し, 現在の隆起速度と一致するようにマントルの粘性構造を決めることができる(Peltier, 1998). 下部マントルの平均的な粘性は1020-21 Pasで, 緩和時間でいうと数千年になる. このような長い時間スケールの岩石の振る舞いを実験室で精度よく調べることは難しく, 今述べたような観測とモデルとの比較に依らざるを得ない. 3. 地震の余効変動と粘弾性
固体地球の粘弾性を示す現象は他にもある. 図2は関東地震前後の油壺験潮所の潮位を示す(Thatcher & Rundle, 1979). 地震により三浦半島が隆起したので潮位が下がり, その後, 地震前と異なる速度で戻ってきている. これは次のように解釈できる. 地震により地殻やマントルに急激な応力変化が生じ変形が起きる. 地球が弾性体であればそれで変形は終了だが, 地殻下部や上部マントルに加わった応力は, 粘性のために徐々に緩和していく. このように地震後, 数10年以上も続くような余効変動は他の大地震でも捉えられている. 物理モデルもポストグレイシャルリバウンドと同じように構築できる. 境界条件は, 地球表面は荷重がないので自由表面とし, 断層面の位置には変位のくいちがいをt>=0t>=0に与える. モデルと観測値の比較から, 地殻下部や上部マントルの粘性は1018-19 Pasのオーダーに求まることが多い. 余効変動はポストグレイシャルリバウンドよりも変形の空間スケールが小さいため, プレート境界浅部のより局地的な粘性を反映していると考えられる. 余効すべりやゆっくり地震と異なり, 粘弾性余効変動は断層すべりによって生じる変形ではない. しかしながら, 間接的に断層面の固着の推定に関係する. インターサイスミック期の地殻変動を解釈する際, 過去の大地震による粘弾性変形の寄与を適切に取り除かないと, 固着の過小/過大評価してしまう可能性がある. また, 粘性を正しく推定することで, 大地震のサイクルにおける応力の時空間変化を精度よくシミュレートすることができる. このような意味で, 地震後の余効変動の観測とモデリングは, 地震サイクルの定量的な理解のために重要である. 図2. 関東地震前後の油壺の潮位 4. 粘弾性余効変動と超巨大地震
モデルと観測値を比較して推定する粘性は, 当然ながらモデルの諸要素(半無限媒質にするか成層構造にするか, 3次元的な粘弾性・密度構造を考慮するか, 重力の効果も含めるか等)にも依存する. 様々な研究者がより現実に近いモデルを考案してきており, 近年は有限要素法の利用も多い(e.g. Suito and Hirahara, 1999, Tanaka et al., 2011 ). 最近, 超巨大地震による数100kmスケールの変形を解釈するために, 地球の曲率を考慮したモデルの必要性が高まっている. 曲率や重力の効果をより自然な形で扱うには, 地球を球体としたモデルが適している(田中, 2013). これまで粘弾性余効変動を球体で扱うには数理的な困難が存在していたが, いくつかの回避方法が提案されている(Tanaka et al., 2007, Tanaka et al., 2011). 曲率の影響を加味するだけでなく, 球体モデルはGRACEによる衛星重力データとの比較も容易なため, 地上GNSS観測では空間分解能が限られるような海域周辺で発生する超巨大地震のメカニズムを推定するのに威力を発揮する. 図は, 2004年スマトラ大地震後の重力変化が粘弾性余効果変動でよく説明できることを示している. 図3. 2004年スマトラ大地震による地震後の重力変化(Tanaka et al., 2014). 左:GRACE衛星重力ミッションによる観測値. 2005年と2011年の平均値の差. 単位はmicroGal. 右:球体モデルを用いて計算した同期間の粘弾性変形による重力変化. 5. 今後の展望
今後, データ解析の面では, 重力と地表変位の観測データを組み合わせることで, 断層すべり分布と粘性の同時推定をより精度よく行う手法の開発, 理論面では, 非線形な応力―歪関係, 地形, 粘弾性構造の3次元不均質等を考慮したモデルの開発が求められている. 粘弾性変形による地下の応力変化を見積もることは, 余震のトリガーの可能性を評価する上でも重要な課題である. 参考文献
http://www.eri.u-tokyo.ac.jp/okubo/ResearchHP/HP16.Viscoelasticity.pdf
Turcotte, D. L. and G. Schubert, Geodynamics, second edition, Cambridge University Press, Cambridge, England, 2002, 456 pp. (Chapter 7)
Karato, S., 2003. The Dynamic Structure of the Deep Earth, An Interdisciplinary Approach, 264 pp., Princeton Univ. Press, NJ.
Peltier, W. R., 1998. Postglacial variations in the level of the sea: implications for climate dynamics and solid-Earth geophysics, Rev. Geophys., 36, 603-689.
Sella, G. F., S. Stein, T. H. Dixon, M. Craymer, T. S. James, S. Mazzotti, and R. K. Dokka, 2007. Observation of glacial isostatic adjustment in ‘‘stable’’ North America with GPS, Geophys. Res. Lett., 34, L02306, doi:10.1029/2006GL027081.
Thatcher, W., and J. B. Rundle, 1979. A model for the earthquake cycle in underthrust zones, J. Geophys. Res., 84(B10), 5540–5556, doi:10.1029/JB084iB10p05540.
深畑幸俊 (2009): 線形粘弾性問題の時間無限大の解, 応用数理, 19, No.2, 84-96.
田中愛幸, 巨大地震による長期的な地殻変動及び重力場変動を球体地球モデルを用いて正確に見積もるための理論計算手法について, 測地学会誌, 59, 1-10, 2013.
Suito, H. & Hirahara, K., 1999. Simulation of postseismic deformations caused by the 1896 Riku-u earthquake, northeast Japan: Re-evalution of the viscosity in the upper mantle, Geophys. Res. Lett., 26, 2561–2564.
Tanaka, Y., Okuno, J.&Okubo, S., 2007. A new method for the computation of global viscoelastic post-seismic deformation in a realistic earth model (II)—horizontal displacement, Geophys. J. Int., 170, 1031–1052.
Tanaka, Y., V. Klemann, Z. Martinec and R. E. M. Riva, 2011. Spectral-finite element approach to viscoelastic relaxation in a spherical compressible Earth: application to GIA modelling, Geophys. J. Int., 184, 220-234.
Tanaka, Y., T. Hasegawa, H. Tsuruoka, V. Klemann and Z. Martinec, 2014. Spectral-finite element approach to viscoelastic relaxation in a spherical compressible Earth: application to the gravity field variations due to the 2004 Sumatra-Andaman earthquake, Geophys. J. Int., submitted.
|
|
>>13 12さんの紹介されている記事と番組では言っていることが異なる失礼 日野亮太教授のシミュレーションか 番組と矛盾は特にないとは思うが http://www.nature.com/nature/journal/v514/n7520/full/nature13778.html
Prevalence of viscoelastic relaxation after the 2011 Tohoku-oki earthquake Tianhaozhe Sun, Kelin Wang, Takeshi Iinuma, Ryota Hino, Jiangheng He, Hiromi Fujimoto, Motoyuki Kido, Yukihito Osada, Satoshi Miura, Yusaku Ohta & Yan Hu
AffiliationsContributionsCorresponding author
Nature 514, 84–87 (02 October 2014) doi:10.1038/nature13778
Received 09 July 2014 Accepted 20 August 2014 Published online 17 September 2014
Article tools
PDF
Citation
Reprints
Rights & permissions
Article metrics
After a large subduction earthquake, crustal deformation continues to occur, with a complex pattern of evolution1. This postseismic deformation is due primarily to viscoelastic relaxation of stresses induced by the earthquake rupture and continuing slip (afterslip) or relocking of different parts of the fault2, 3, 4, 5, 6. When postseismic geodetic observations are used to study Earth’s rheology and fault behaviour, it is commonly assumed that short-term (a few years) deformation near the rupture zone is caused mainly by afterslip, and that viscoelasticity is important only for longer-term deformation6, 7. However, it is difficult to test the validity of this assumption against conventional geodetic data. Here we show that new seafloor GPS (Global Positioning System) observations immediately after the great Tohoku-oki earthquake provide unambiguous evidence for the dominant role of viscoelastic relaxation in short-term postseismic deformation. These data reveal fast landward motion of the trench area, opposing the seaward motion of GPS sites on land. Using numerical models of transient viscoelastic mantle rheology, we demonstrate that the landward motion is a consequence of relaxation of stresses induced by the asymmetric rupture of the thrust earthquake, a process previously unknown because of the lack of near-field observations. Our findings indicate that previous models assuming an elastic Earth will have substantially overestimated afterslip downdip of the rupture zone, and underestimated afterslip updip of the rupture zone; our knowledge of fault friction based on these estimates therefore needs to be revised. Subject terms: Geodynamics Seismology Tectonics Geophysics
At a glance
Figures
First | 1-3 of 9 | Last
View all figures
left
Coseismic and postseismic deformation of the 2011 Tohoku-oki earthquake.
Figure 1
Numerical models of short-term viscoelastic relaxation.
Figure 2
Observed (red) and model-predicted (blue) time series of the east component of postseismic displacements.
Figure 3
Illustration of the Burgers rheology used in this work.
Extended Data Fig. 1
Central part of the finite element mesh for modelling deformation associated with the Tohoku-oki earthquake.
Extended Data Fig. 2
Postseismic (1 year) deformation results of model B in Extended Data Table 1.
Extended Data Fig. 3
East component of postseismic displacements of model B in Extended Data Table 1.
Extended Data Fig. 4
Layout of PXPs (precision transponders) at seafloor GPS site GJT3.
Extended Data Fig. 5
Postseismic survey results for seafloor GPS site GJT3.
Extended Data Fig. 6
right
Tables
Main
Main• Methods• References• Acknowledgements• Author information• Extended data figures and tables
Land-based GPS observations from multiple subduction zones delineate three stages of postseismic deformation following a great megathrust earthquake: wholesale seaward motion, opposing motion of the coastal and inland areas, and wholesale landward motion1. This progressive motion reversal contains important information on Earth’s viscoelastic rheology and the slip behaviour of subduction megathrusts1, 2, 3, 4, 5. However, we know surprisingly little about the mechanism of postseismic deformation at the timescale of a few years. During the Tohoku-oki earthquake, seven seafloor GPS stations operated by the Japan Coast Guard8 (JCG) and Tohoku University9 (TU) detected seaward displacements of up to 31 m, much larger than the largest coseismic motion of coastal GPS sites (~5 m; ref. 10) (Fig. 1). Many rupture models, in particular those involving tsunami data and seafloor geodetic observations, feature peak slip exceeding 50 m at rather shallow depths and breaching the trench11, 12, 13, 14. Figure 1: Coseismic and postseismic deformation of the 2011 Tohoku-oki earthquake.
Coseismic and postseismic deformation of the 2011 Tohoku-oki earthquake.
a, Coseismic displacements of land (for example, ref. 10) and seafloor8, 9 GPS sites and model predicted displacements based on the fault slip model shown (see Methods). b, One-year postseismic displacements of land15 and seafloor (refs 16 and 17 and Methods) GPS sites and model predicted values based on the viscoelastic model of this work. Seafloor GPS vectors were obtained through fitting campaign data with logarithmic functions as in Extended Data Fig. 6. Site GJT4 failed shortly after the earthquake. Black contours (m) are the afterslip distribution used in our modelling (see Methods). Observed and model time series at sites marked with a green circle in the main corridor of interest are shown in Fig. 3. Full size image (447 KB)
Download PowerPoint slide (550 KB)
Figures/tables index
Next
After the earthquake, the terrestrial GPS network in northeast Japan continued to show wholesale seaward motion as expected (Fig. 1b). These terrestrial observations can be adequately explained by an afterslip model15 similar to those developed for most other subduction earthquakes and also based only on terrestrial observations6. However, seafloor GPS observations near the trench present a fundamental challenge to the validity of ignoring viscoelastic stress relaxation in short-term postseismic deformation. Whereas some of the seafloor sites also exhibited seaward motion, sites nearest to the peak rupture area immediately reversed their direction from coseismic seaward to postseismic landward (Fig. 1b). These data demonstrate that opposing motion begins immediately after the earthquake, a phenomenon previously unknown because of the lack of seafloor observations. The motion of these sites (Fig. 1b), ~50 cm at TU site GJT3 (Extended Data Figs 5 and 6) and ~20–25 cm at JGC sites KAMS and MYGI in the first year (refs 16, 17), is much faster than the subduction rate (8.3 cm yr-1) at the Japan Trench18 and thus cannot be explained by the relocking of the subduction fault. Neither can it be explained by afterslip, which would cause the surface to move in the opposite (seaward) direction6, 15. The effect of poroelastic rebound after the earthquake is far too small to explain the observed motion, even in a model that maximizes such an effect19. Therefore, the primary process responsible for this motion must be viscoelastic relaxation20. We explain the immediate landward motion of the trench area, represented by sites GJT3, KAMS and MYGI, as a manifestation of viscoelastic relaxation of stresses induced by the asymmetric rupture of the Tohoku-oki earthquake. We first use a simple two-dimensional (2D) model (Fig. 2a) to elucidate the physical process. This simple model captures the essence of viscoelastic deformation in earthquake cycles1, 3: the tectonic plates exhibit elastic behaviour, and the asthenospheric mantle deforms elastically at the time of the earthquake but increasingly exhibits viscous behaviour afterwards (Extended Data Fig. 1). Figure 2: Numerical models of short-term viscoelastic relaxation.
Numerical models of short-term viscoelastic relaxation.
a, A 2D generic subduction earthquake model used to illustrate the consequence of asymmetric rupture. Fault slip, s, is denoted by a solid orange line, and tapers to zero over dashed portions. Greater tensile stress is coseismically induced in the upper plate than in the incoming plate (diverging arrows). b, Horizontal coseismic (t = 0) and postseismic (t > 0) displacements (u) of the three colour coded sites in Fig. 2a in response to the earthquake. τM is the Maxwell time of the mantle wedge (Extended Data Fig. 1). Solid lines show results based on a model with 30-km-thick upper and lower plates and a rigidity and viscosity structure similar to previous subduction earthquake cycle models1, 3, 23 and identical to model B in Extended Data Table 1. In the ‘thicker slab’ model, the lower plate is twice as thick; in the ‘higher viscosity’ model, the steady-state mantle wedge viscosity is an order of magnitude higher (1020 Pa s). c, Schematic illustration of the structure of the 3D model for the 2011 Tohoku-oki earthquake, with results shown in Figs 1 and 3. Full size image (241 KB)
Download PowerPoint slide (586 KB)
Previous
Figures/tables index
Next
Asymmetric coseismic elastic deformation is a fundamental outcome of any thrust rupture that is not deeply buried. Because of the presence of the free surface (seafloor), the hanging wall overlying the rupture is less stiff than the foot wall beneath. Consequently, even though the double-couple source mechanism is symmetric, the hanging wall undergoes greater coseismic motion than does the foot wall. In subduction earthquakes, the asymmetry is very pronounced owing to the shallow dip and depth of the megathrust (Fig. 2a). The maximum seaward motion of the upper plate is larger than the maximum landward motion of the incoming plate often by an order of magnitude. Systematic spatial variations in rock rigidity or plastic yielding in parts of the system can only slightly modify the relative magnitude of the motion but cannot reduce the asymmetry in any substantive fashion. The asymmetric rupture induces greater tension in the upper plate than in the incoming plate (Fig. 2a). The stress asymmetry around the rupture zone is accompanied by heterogeneous incremental stresses in the rest of the coseismically elastic system that, for static deformation, balance the net force and torque. As the underlying mantle undergoes viscoelastic relaxation after the earthquake1, 3, the greater tension in the upper plate pulls the trench area landward (Fig. 2b). The site in the rupture area reverses its direction of motion immediately after the earthquake in all the models, irrespective of the vastly different parameters used. For example, a very thick subducting plate or highly viscous mantle can slow down the motion but cannot prevent it from occurring (Fig. 2b). In the real Earth, the only process that may offset or even reverse this motion in limited areas is fast afterslip, especially at very shallow depths such as that observed after the 2005 moment magnitude Mw = 8.7 Sumatra earthquake7. At the Japan Trench, the very fast seaward motion of JCG site FUKU, outside the main rupture area (Fig. 1b), is undoubtedly caused by shallow afterslip. We think that the lack of landward motion of JCG site KAMN is probably because the motion was offset by local afterslip, an issue that we do not have adequate information to explore in our modelling. To apply the conceptual model illustrated in Fig. 2a and b to the seafloor GPS observations after the Tohoku-oki earthquake, we developed a three-dimensional (3D) spherical-Earth finite element model (see Methods) involving the Burgers mantle rheology (Extended Data Fig. 1) and the actual fault geometry (Extended Data Fig. 2). Our main region of interest is the broad margin-normal corridor including the peak rupture area and sites GJT3, MYGI, KAMS and MYGW. To focus on the first-order physical process, we purposely simplified the model by using uniform material properties for each of the major structural units (model A in Extended Data Table 1). Elastic modulus values are the same as in ref. 1 except for those required by the transient rheology (Extended Data Fig. 1), for which larger values better reproduce postseismic motion of all the land GPS sites in the first few weeks. The most seaward part of the mantle wedge overlying the shallower-than-70-km part of the slab is an elastic ‘cold nose’ (Fig. 2c), representing the stagnant and cold part of the mantle wedge21 and consistent with the results of seismic tomography in this region22. Between the cold nose and the slab, the plate interface changes from a distinct fault at shallow depths to a thin viscoelastic shear zone at greater depths (see Methods). Differently from previous models, we included a weak layer (Extended Data Table 1) below the oceanic plate, approximately accounting for the recently but widely reported mechanical decoupling of the oceanic lithosphere from the underlying mantle material (see Methods). All the viscosity values were optimized to fit observations via a trial-and-error approach. We used a coseismic rupture model slightly modified (see Methods) from ref. 12 (Fig. 1a). Our tests show that different choices of coseismic slip models14 may lead to slightly different estimates of viscosity values but do not change the physical process demonstrated by the model. Because postseismic GPS observations reflect both viscoelastic relaxation and afterslip, we must consider both processes to allow meaningful comparisons with data23. We opted to revise the afterslip model of ref. 15 and combine it into our 3D viscoelastic model in a trial-and-error fashion. The introduction of viscoelasticity as required by seafloor observations greatly reduced the amount of afterslip required to explain the land GPS data. The afterslip values shown in Fig. 1b have been reduced from those of ref. 15 by as much as 95% directly downdip of the main rupture area and by about 30% farther away (see Methods). Our model does not include shallow and/or trench-breaching afterslip and therefore is not designed to explain the motion of site FUKU (see Methods). If significant shallow afterslip did occur in our main corridor of interest, the landward motion of seafloor GPS sites due to viscoelastic relaxation should be even faster than shown in Fig. 1b, further strengthening the main argument of this Letter. Our 3D model adequately explains the spatial (Fig. 1b) and temporal (Fig. 3) patterns of postseismic deformation. Even in areas away from the main corridor of interest, the model fits GPS observations to a considerable degree of fidelity. Second-order temporal variations in the GPS time series, such as the brief slowing down of KAMS during 2012 and the motion reversal of GJT3 in 2013, may be due to local adjustment of the megathrust (delayed afterslip) and cannot be explained by viscoelastic relaxation (Fig. 3a). Steady-state viscosities in this model (model A in Extended Data Table 1) are lower than in previous models1 that were based mostly on longer-term postseismic and interseismic observations (see also Extended Data Figs 3 and 4). The reason is most probably that transient mantle rheology is more complex than described by the Burgers model (Extended Data Fig. 1) and our steady-state viscosity based on the ~3 years of postseismic observations may still be affected by transient creep. Figure 3: Observed (red) and model-predicted (blue) time series of the east component of postseismic displacements.
Observed (red) and model-predicted (blue) time series of the east component of postseismic displacements.
The locations of the GPS sites are shown in Fig. 1b. a, Seafloor sites. For TU site GJT3, error bars (standard error) are based on error analysis, and sub-arrays are formed by different combinations of seafloor transponders, both as explained in Methods. For the JCG sites16, 17, error estimates were not provided but are estimated to be smaller than those of GJT3 (see Methods) except for the first one or two less reliable measurements at each site (open stars). Circles for KAMS represent position data after a manual correction for an assumed delayed local afterslip during 2012. The one-year vector for this site shown in Fig. 1b is based on the corrected data. b, Randomly selected land sites in the main corridor of interest. Other sites in this corridor have similar results. Full size image (385 KB)
Download PowerPoint slide (312 KB)
Previous
Figures/tables index
Our numerous testing runs using both 2D and 3D models (not all displayed here) show that landward trench motion does not occur in any purely elastic model but always occurs in viscoelastic models irrespective of the details of the viscoelastic mantle rheology, afterslip and model structure. Therefore, in elastic models for any large subduction earthquakes, afterslip downdip of the rupture zone will have been overestimated, and afterslip at shallower depths, if present and resolvable by observations7, will have been underestimated. Reassessing afterslip using viscoelastic models will lead to a revision of our knowledge of the slip behaviour and physics of subduction megathrusts. Methods
Main• Methods• References• Acknowledgements• Author information• Extended data figures and tables
Finite element model
We assume that the mantle obeys the bi-viscous Burgers rheology1, 3. The Kelvin solid of viscosity ηK and rigidity μK and the Maxwell fluid of viscosity ηM and rigidity μM in the Burgers body (Extended Data Fig. 1) are the simplest parameterizations of the transient and steady-state rheology, respectively24. The characteristic timescales of the transient and steady-state rheology are thus represented by the Kelvin relaxation time τK = ηK/μK and Maxwell relaxation time τM = ηM/μM, respectively. Note that µK is not a real physical property but a parameter introduced to control the initial rate of transient creep of mantle material without invoking more parameters. Secular mantle wedge flow maintains high temperatures in the arc and back arc region21. The different thermal states of the two sides can result in not only different thicknesses of the elastic plates, but also differences in the viscosities of the mantle below. Following the arguments of ref. 1, we required the viscosities of the mantle wedge to be about one order of magnitude lower than those of the oceanic mantle (Extended Data Table 1). We used the spherical-Earth finite-element code PGCviscl-3D developed by J.H. The code uses 27-node isoparametric elements throughout the model domain. The effect of gravitation is incorporated using the stress-advection approach25. Coseismic rupture and afterslip are simulated using the split-node method26. Time (t) integration is performed using a fully implicit algorithm, with time steps no greater than 0.01τk for t < τk and no greater than 0.01τM for t < 0.5τM. The parallel code has been extensively benchmarked against analytical deformation solutions for elastic, Maxwell and Burgers materials and applied to subduction zone earthquake cycle modelling1, 23. The central part of the element mesh for the Tohoku-oki model is shown in Extended Data Fig. 2. The subduction fault geometry was constrained by earthquake relocation results and seismic reflection profiles27, 28, 29 and is similar to what was used in ref. 12. We accounted for the presence of a cold and stagnant nose of the mantle wedge21, 22 and its sharp landward termination30 by adding a triangular region to the elastic upper plate in the forearc (Fig. 2c and Extended Data Fig. 2). Studies of fault processes indicate that the distinction between shear along a thin fault plane and within a broader shear zone becomes blurry at large depths31. Much of the afterslip is actually shear deformation that gradually spreads over a shear zone that thickens with increasing depth. In our model, between the elastic cold nose and the elastic slab is a layer of viscoelastic mantle material that thickens with increasing depth (Fig. 2c and Extended Data Fig. 2). This layer approximates the deeper fault zone to a depth of 70 km. Deeper than 70–80 km, the mantle wedge is fully coupled with the slab, that is, there is no longer a fault zone that accommodates localized shear such as afterslip21. Recent studies suggest mechanical decoupling at the lithosphere–asthenosphere boundary (LAB)32, 33, 34, due to the presence of either fluids35 or partial melts36, 37. We thus introduced a thin layer of low viscosity underlying the elastic oceanic plate to approximate this effect (Fig. 2c and Extended Data Table 1). This approximate LAB layer decreases the ratio of vertical to horizontal postseismic displacements at the seafloor. Compared to models without this layer, our model predicts smaller postseismic subsidence in the rupture area and is generally more consistent with observations. However, because of the much larger errors in observed vertical deformation, we did not try to fit the vertical data precisely. Assigning coseismic slip and afterslip
In ref. 12, terrestrial and seafloor GPS and ocean bottom pressure data were inverted using a model of a planar fault to determine the coseismic slip distribution. We mapped the slip vectors onto our 3D curved fault surface. The original slip model used a straight line to represent the trench, resulting in a gap between the model rupture zone and the actual curved trench or some slip seaward of the trench. We filled the artificial trench gap by extrapolating slip values from the model rupture zone (Fig. 1a), and the additional slip resulted in a larger seismic moment and surface displacements. We scaled the fault slip to 92% of its original values in order to match the GPS observations (Fig. 1a). We have developed postseismic deformation models using other published rupture models. Different coseismic slip distributions require slightly different mantle viscosity values in order to fit the GPS data, but all lead to the same main conclusions. The afterslip model shown in Fig. 1b (contours) was revised from the model of afterslip 8 months after the earthquake developed in ref. 15. Because the model of ref. 15 assumed a purely elastic Earth, postseismic deformation caused by viscoelastic relaxation was also attributed to afterslip, resulting in over-estimated afterslip. Therefore, we scaled down the afterslip values when assigning them to our finite element mesh. Unlike the uniform scaling ratio used for coseismic slip, we needed to use a smoothly variable function for the afterslip scaling. With trial-and-error, the scaling factor was determined to be ~0.05 downdip of the main rupture zone at ~60–70 km depth, ~0.35 to the north of the main rupture zone, and ~0.7 to the south of the main rupture zone. For the temporal evolution of the afterslip, we used the power-law function reported in ref. 23 with a characteristic timescale of 1.5 years. Our model does not include any shallow afterslip near or breaching the trench. For our main corridor of interest, the assumption of no shallow afterslip is supported by the fact that a postseismic thermal-sensor monitoring string deployed in a near-trench borehole was retrieved intact38, indicating no trench-breaching afterslip at this site during the monitoring period (16–24 months after the Tohoku-oki earthquake). If there is significant shallow afterslip before the monitoring period or in other parts of our main corridor of interest, the actual landward motion of sites GJT3, MYGI and KAMS due to viscoelastic relaxation should be even faster than shown by the GPS data. For this reason, our model represents a minimum estimate of the effect of viscoelastic relaxation. Model using the viscosity values of ref. 1
Testing model B (Extended Data Table 1) shows why we cannot use the viscosity structure and values used in ref. 1. A mantle wedge Maxwell viscosity of 1019 Pa s was used in ref. 1 for a study of longer-term postseismic deformation. If the same value is used in our model, it is possible to explain cumulative GPS displacements observed at a specific time (Extended Data Fig. 3) but very difficult to explain the time-dependent evolution of the deformation field (Extended Data Fig. 4). Seafloor/acoustic observation at GJT3
GJT3 operated by Tohoku University is the most important seafloor GPS site in this study because it is the nearest to the trench. The basic concept of the GPS/acoustic technique used by Tohoku University to make seafloor geodetic measurements was developed originally by the Scripps Institution of Oceanography39, 40. The technique measures the horizontal displacement of the virtual seafloor benchmark, the centre of an array of at least three seafloor precision transducers (PXPs), by repeated surveys using a sea surface platform equipped with GPS antennas and an acoustic transducer41. Two survey methods can be used. In the fixed-point survey method, routinely used by Tohoku University, the surface platform is placed above the centre of the PXP array. If the array geometry does not change with time, the fixed-point survey method can be used to monitor the horizontal motion of the virtual benchmark. In the moving survey method, routinely used by JCG42, the platform moves around each individual PXP to determine its absolute position. This procedure is more robust because no assumptions on PXP array geometry are required, but it is very time consuming. Given precise position of the surface platform, two-way travel times between the platform and the PXPs, and knowledge of temporal variations in underwater sound speed, the horizontal position of the array is determined by simultaneous ranging of a single acoustic ping to all the transponders43. If the sound speed structure is horizontally stratified, this method is expected to give reliable estimates of the array position. However, temporal changes and three-dimensional heterogeneities of the sound speed structure often cause the position measurements to fluctuate. During a campaign, we take an ensemble mean of many measurements to estimate the array position, such that much of the effects of the sound speed anomalies are averaged out. Within the first two years after the Tohoku-oki earthquake, Tohoku University conducted four campaign surveys at GPS/acoustic station GJT3, located above the main rupture area (Fig. 1). The first measurement, made in April 2011, showed a displacement of about 31 m due mainly to coseismic motion9. This and the two subsequent surveys in 2012 used only the fixed-point method because of limited ship time allocation. In 2013, we used the moving survey method to reassess the array geometry at this site while continuing to use the fixed-point method to determine the position of the virtual seafloor benchmark. The moving survey results indicated that the PXP array geometry had changed, most likely during the earthquake. Given the proximity of the site to the peak rupture area (Fig. 1), this finding is not surprising. For the very large coseismic displacement9, errors due to incorrectly assuming rigid array geometry are negligibly small. For the much smaller postseismic displacements, however, this assumption leads to significant errors. We conclude that the postseismic motion of GJT3 based on the fixed-point survey results of 2012 alone44 had yielded an incorrect direction of motion. There is no obvious reason why the array geometry would have suffered further significant distortion after the earthquake. Therefore, in the present study, we reprocessed all the postseismic data using the PXP geometry newly determined in 2013. The JCG array positions shown in Figs 1 and 3 were determined by averaging the positions of individual PXPs. Without invoking fixed-point survey, a large amount of ship time is required in order to minimize errors caused by the uncertainties of individual PXP locations. However, because no assumptions about array geometry are involved, the locations of the seafloor benchmark estimated by JCG are minimally affected by potential coseismic distortion of array geometry. Regardless of the survey method, uncertainties in the position of individual PXPs can be a source of error in estimating the array position. When a fixed-point survey is made near the array centre, uncertainties in PXP positions do not affect the estimation of the array position. However, the estimation error rapidly increases with the offset of the surface platform from the array centre. Keeping the platform at the centre was especially difficult during the survey in April 2011 when large amounts of tsunami debris drifted around the site and prevented the research vessel from staying at the optimum location. Another factor we have to take into account is site displacement caused by nearby major aftershocks. An Mw 7 intraslab earthquake occurred on 10 July 2011, and had a strike-slip mechanism. The epicentre is only about 20 km from GJT3 and induced coseismic displacement that cannot be ignored. Its fault location was defined by the aftershock distribution precisely determined with an ocean bottom seismic network45, and its slip model was estimated from near-field tsunami waveforms46. Using this information, we estimated that the displacement of GJT3 due to this event was 2.0 cm westward and 6.6 cm southward. Extended Data Fig. 5 shows the PXP array configuration at GJT3. Excluding PXPs EJ16 and EJ23, which were installed for testing purposes, the PXPs form an equilateral triangle with side length of ~2.5 km. Two PXPs (EJ15 and EJ22) are collocated at one of the apexes. Since the array position can be determined using the fixed-point observation with three seafloor PXPs, we can have two different sub-arrays: sub-array 1, composed of PXPs EJ15, EJ12 and EJ13, and sub-array 2, composed of PXPs EJ22, EJ12 and EJ13. Extended Data Fig. 6 shows the time series of the array positions of the two sub-arrays after a correction for the effect of the 2011 Mw 7 earthquake discussed above. Position error in each campaign is estimated from the root-mean-squares of position measurements around the mean position and uncertainties in PXP positioning. Here, we assumed that the PXP positions determined by the moving survey method contain 1 m uncertainties, based on uncertainties in the sound speed of the order of 0.01% and the slant ranges from the surface platform to PXPs at ~4,000 m. Consistency between the two sub-arrays suggests the robustness of the results. References
Main• Methods• References• Acknowledgements• Author information• Extended data figures and tables
Wang, K., Hu, Y. & He, J. Deformation cycles of subduction earthquakes in a viscoelastic Earth. Nature 484, 327–332 (2012)
CASPubMedArticle
Show context
Hu, Y., Wang, K., He, J., Klotz, J. & Khazaradze, G. Three-dimensional viscoelastic finite element model for post-seismic deformation of the great 1960 Chile earthquake. J. Geophys. Res. 109, B12403 (2004)
Article
Show context
Pollitz, F. F., Bürgmann, R. & Banerjee, P. Post-seismic relaxation following the great 2004 Sumatra-Andaman earthquake on a compressible self-gravitating Earth. Geophys. J. Int. 167, 397–420 (2006)
Article
Show context
Suito, H. & Freymueller, J. T. A viscoelastic and afterslip postseismic deformation model for the 1964 Alaska earthquake. J. Geophys. Res. 114, B11404 (2009)
Article
Show context
Kogan, M. G. et al. Rapid postseismic relaxation after the great 2006–2007 Kuril earthquakes from GPS observations in 2007–2011. J. Geophys. Res. 118, 3691–3706 (2013)
Article
Show context
Pritchard, M. E. & Simons, M. An aseismic slip pulse in northern Chile and along-strike variations in seismogenic behavior. J. Geophys. Res. 111, B08405 (2006)
Article
Show context
Hsu, Y.-J. et al. Frictional afterslip following the 2005 Nias-Simeulue earthquake, Sumatra. Science 312, 1921–1926 (2006)
CASISIPubMedArticle
Show context
Sato, M. et al. Displacement above the hypocenter of the 2011 Tohoku-Oki earthquake. Science 332, 1395 (2011)
CASPubMedArticle
Show context
Kido, M., Osada, Y., Fujimoto, H., Hino, R. & Ito, Y. Trench-normal variation in observed seafloor displacements associated with the 2011 Tohoku-Oki earthquake. Geophys. Res. Lett. 38, L24303 (2011)
Article
Show context
Ozawa, S. et al. Coseismic and postseismic slip of the 2011 magnitude-9 Tohoku-Oki earthquake. Nature 475, 373–376 (2011)
CASPubMedArticle
Show context
Fujii, Y., Satake, K., Sakai, S., Shinohara, M. & Kanazawa, T. Tsunami source of the 2011 off the Pacific coast of Tohoku earthquake. Earth Planets Space 63, 815–820 (2011)
Article
Show context
Iinuma, T. et al. Coseismic slip distribution of the 2011 off the Pacific Coast of Tohoku Earthquake (M9.0) refined by means of seafloor geodetic data. J. Geophys. Res. 117, B07409 (2012)
Article
Show context
Shao, G., Chen, J. & Archuleta, R. Quality of earthquake source models constrained by teleseismic waves: using the 2011 M9 Tohoku-oki earthquake as an example. (Poster 93, presented at Incorporated Research Institutions for Seismology Workshop, Boise, Idaho, 13–15 June, 2012); available at http://www.iris.edu/hq/iris_workshop2012/scihi/WebPages/0115.html
Show context
Tajima, F., Mori, J. & Kennett, B. L. N. A review of the 2011 Tohoku-oki earthquake (Mw 9.0): large-scale rupture across heterogeneous plate coupling. Tectonophysics 586, 15–34 (2013)
Article
Show context
Ozawa, S. et al. Preceding, coseismic, and postseismic slips of the 2011 Tohoku earthquake, Japan. J. Geophys. Res. 117, B07404 (2012)
Article
Show context
Japan Coast Guard & Tohoku University. Seafloor movements observed by seafloor geodetic observations after the 2011 off the Pacific coast of Tohoku earthquake. Rep. Coord. Committee Earthquake Prediction 90, 3–4 (2013)
Show context
Watanabe, S. et al. Evidence of viscoelastic deformation following the 2011 Tohoku-oki earthquake revealed from seafloor geodetic observation. Geophys. Res. Lett. (in the press); preprint at http://onlinelibrary.wiley.com/doi/10.1002/2014GL061134/abstract
Show context
DeMets, C., Gordon, R. G. & Argus, D. F. Geologically current plate motions. Geophys. J. Int. 181, 1–80 (2010)
ISIArticle
Show context
Hu, Y., Burgmann, R., Freymueller, J. F., Banerjee, P. & Wang, K. Contributions of poroelastic rebound and a weak volcanic arc to the postseismic deformation of the 2011 Tohoku earthquake. Earth Planets Space 66, 106 (2014)
Article
Show context
Sun, T. et al. Viscoelastic landward motion of the trench area following a subduction earthquake. Abstr. G14A–08 (Fall Meeting, AGU, San Francisco, 9–13 December, 2013); available at http://adsabs.harvard.edu/abs/2013AGUFM.G14A..08S
Show context
Wada, I. & Wang, K. Common depth of decoupling between the subducting slab and mantle wedge: reconciling diversity and uniformity of subduction zones. Geochem. Geophys. Geosyst. 10, Q10009 (2009)
Article
Show context
Yamamoto, Y., Hino, R. & Shinohara, M. Mantle wedge structure in the Miyagi Prefecture forearc region, central northeastern Japan arc, and its relation to corner-flow pattern and interplate coupling. J. Geophys. Res. 116, B10310 (2011)
Article
Show context
Hu, Y. & Wang, K. Spherical-Earth finite element model of short-term postseismic deformation following the 2004 Sumatra earthquake. J. Geophys. Res. 117, B05404 (2012)
Show context
Peltier, W. R., Wu, P. & Yuen, D. A. in Anelasticity in the Earth (eds Stacey, F. D., Paterson, M. S. & Nicolas, A.) 59–77 (Geodynamics Ser. Vol. 4, American Geophysical Union, 1981)
Show context
Peltier, W. R. The impulse response of a Maxwell Earth. Rev. Geophys. Space Phys. 12, 649–668 (1974)
Article
Show context
Melosh, H. J. & Raefsky, A. A simple and efficient method for introducing faults into finite element computations. Bull. Seismol. Soc. Am. 71, 1391–1400 (1981)
Show context
Nakajima, J. & Hasegawa, A. Anomalous low-velocity zone and linear alignment of seismicity along it in the subducted Pacific slab beneath Kanto, Japan: reactivation of subducted fracture zone? Geophys. Res. Lett. 33, L16309 (2006)
Article
Show context
Kita, S., Okada, T., Hasegawa, A., Nakajima, J. & Matsuzawa, T. Anomalous deepening of a seismic belt in the upper-plane of the double seismic zone in the Pacific slab. Earth Planet. Sci. Lett. 290, 415–426 (2010)
CASArticle
Show context
Zhao, D., Wang, Z., Umino, N. & Hasegawa, A. Mapping the mantle wedge and interplate thrust zone of the northeast Japan arc. Tectonophysics 467, 89–106 (2009)
Article
Show context
Wada, I., Rychert, C. A. & Wang, K. Sharp thermal transition in the forearc mantle wedge as a consequence of nonlinear mantle wedge flow. Geophys. Res. Lett. 38, L13308 (2011)
Article
Show context
Noda, H. & Shimamoto, T. Transient behavior and stability analyses of halite shear zones with an empirical rate-and-state friction to flow law. J. Struct. Geol. 38, 234–242 (2012)
Article
Show context
Kawakatsu, H. et al. Seismic evidence for sharp lithosphere-asthenosphere boundaries of oceanic plates. Science 324, 499–502 (2009)
CASPubMed
Show context
Rychert, C. A. & Shearer, P. M. A global view of the lithosphere-asthenosphere boundary. Science 324, 495–498 (2009)
CASPubMedArticle
Show context
Fischer, K. M., Ford, H. A., Abt, D. L. & Rychert, C. A. The lithosphere-asthenosphere boundary. Annu. Rev. Earth Planet. Sci. 38, 551–575 (2010)
CASArticle
Show context
Karato, S. On the origin of the asthenosphere. Earth Planet. Sci. Lett. 321–322, 95–103 (2012)
Show context
Sakamaki, T. et al. Ponded melt at the boundary between the lithosphere and asthenosphere. Nature Geosci. 6, 1041–1044 (2013)
CASArticle
Show context
Schmerr, N. The gutenberg discontinuity: melt at the lithosphere-asthenosphere boundary. Science 335, 1480–1483 (2012)
CASPubMedArticle
Show context
Fulton, P. M. et al. Low coseismic friction on the Tohoku-oki fault determined from temperature measurements. Science 342, 1214–1217 (2013)
CASPubMedArticle
Show context
Spiess, F. N. Suboceanic geodetic measurements. IEEE Trans. Geosci. Remote Sens. GE-23, 502–510 (1985)
Show context
Fujimoto, H. Seafloor geodetic approaches to subduction thrust earthquakes. Monogr. Environ. Earth Planets 2, 23–63 (2014)
Article
Show context
Kido, M. et al. Seafloor displacement at Kumano-nada caused by the 2004 off Kii Pen-insula earthquakes, detected through repeated GPS/acoustic surveys. Earth Planets Space 58, 911–915 (2006)
Article
Show context
Sato, M. et al. Interplate coupling off northeastern Japan before the 2011 Tohoku-oki earthquake, inferred from seafloor geodetic data. J. Geophys. Res. 118, 3860–3869 (2013)
Article
Show context
Kido, M., Osada, Y. & Fujimoto, H. Temporal variation of sound speed in ocean: a comparison between GPS/acoustic and in situ measurements. Earth Planets Space 60, 229–234 (2008)
Article
Show context
Osada, Y. et al. Seafloor crustal movement observed off Miyagi after the 2011 Tohoku earthquake using GPS-acoustic observation system. Abstr. T13F-2693 (Fall Meeting, AGU, 2012); available at http://adsabs.harvard.edu/abs/2012AGUFM.T13F2693O
Show context
Obana, K. et al. Aftershocks near the updip end of the 2011 Tohoku-Oki earthquake. Earth Planet. Sci. Lett. 382, 111–116 (2013)
CASArticle
Show context
Kubota, T. et al. Source models of M-7 class earthquakes in the rupture area of the 2011 Tohoku-Oki earthquake by near-field tsunami modeling. Abstr. T13B-2594 (Fall Meeting, AGU, 2012); available at http://adsabs.harvard.edu/abs/2012AGUFM.T13B2594K
Show context
Download references Acknowledgements
Main• Methods• References• Acknowledgements• Author information• Extended data figures and tables
We thank the Japan Coast Guard for making available digital values of published data. Comments from M. Sato improved the manuscript. K.W. was supported by Geological Survey of Canada core funding and a Natural Sciences and Engineering Research Council of Canada Discovery Grant through the University of Victoria. T.S. was supported by a University of Victoria PhD Fellowship and a Howard E. Petch Scholarship. The Tohoku University seafloor observation study was supported by the Ministry of Education, Culture, Sports, Science and Technology of Japan under its Earthquake and Volcano Hazards Observation and Research Program. This is Geological Survey of Canada contribution 20140167. Author information
Main• Methods• References• Acknowledgements• Author information• Extended data figures and tables
Affiliations
School of Earth and Ocean Sciences, University of Victoria, Victoria, British Columbia V8P 5C2, Canada
Tianhaozhe Sun & Kelin Wang
Pacific Geoscience Centre, Geological Survey of Canada, Natural Resources Canada, 9860 West Saanich Road, Sidney, British Columbia V8L 4B2, Canada
Kelin Wang & Jiangheng He
International Research Institute of Disaster Science, Tohoku University, Sendai 980-0845, Japan
Takeshi Iinuma, Ryota Hino, Hiromi Fujimoto, Motoyuki Kido & Yukihito Osada
Research Center for Prediction of Earthquakes and Volcanic Eruptions, Graduate School of Science, Tohoku University, Sendai 980-8578, Japan
Satoshi Miura & Yusaku Ohta
Berkeley Seismological Laboratory and Department of Earth and Planetary Sciences, University of California, Berkeley, California, California 94720, USA
Yan Hu
Contributions
T.S. carried out the numerical modelling. K.W. designed the study. K.W. and T.S. together did most of the writing. T.I. processed land GPS data. R.H., H.F., M.K., Y. Osada, S.M. and Y. Ohta collected and processed GJT3 seafloor GPS data. J.H. wrote the modelling code and contributed to the modelling. Y.H. constructed fault geometry and initiated the modelling. Competing financial interests
The authors declare no competing financial interests. Corresponding author
Correspondence to: Kelin Wang
Extended data figures and tables
Main• Methods• References• Acknowledgements• Author information• Extended data figures and tables
Extended Data Figures
Extended Data Figure 1: Illustration of the Burgers rheology used in this work. (94 KB)
The Burgers rheology is represented by a serial connection of a Maxwell fluid of viscosity ηM and rigidity µM and a Kelvin solid of viscosity ηK and rigidity µK. τM and τK are Maxwell and Kelvin relaxation times, respectively. Extended Data Figure 2: Central part of the finite element mesh for modelling deformation associated with the Tohoku-oki earthquake. (622 KB)
Darker layers represent elastic plates. The LAB layer is highlighted in yellow. Structural details are shown in Fig. 2c. GPS sites used to constrain the model in this work are shown in red. Elements near the trench are too fine to be discerned at this plotting scale and hence collectively appear as a blue region. Extended Data Figure 3: Postseismic (1 year) deformation results of model B in Extended Data Table 1. (660 KB)
Otherwise the figure is the same as Fig. 1b. Time series at sites marked with a green circle are shown in Extended Data Fig. 4. Extended Data Figure 4: East component of postseismic displacements of model B in Extended Data Table 1. (366 KB)
Otherwise the figure is the same as Fig. 3. Locations of the GPS sites are shown in Extended Data Fig. 3. Extended Data Figure 5: Layout of PXPs (precision transponders) at seafloor GPS site GJT3. (281 KB)
Grey filled circles are PXPs installed for testing purposes9, not used in this work. Extended Data Figure 6: Postseismic survey results for seafloor GPS site GJT3. (336 KB)
a, East component Dx. b, North component Dy. Open symbols for the first measurement show array position before the effect of the Mw 7.0 intraslab earthquake on 10 July 2011 was removed. Sub-array 1 includes PXP EJ12, EJ13 and EJ15, and sub-array 2 includes PXP EJ12, EJ13 and EJ22 (Extended Data Fig. 5). The straight solid and dashed lines show linear trends of survey results of sub-array 1 and sub-array 2, respectively, with resultant average velocities Vx and Vy for the east and north components, respectively. The red curves show a logarithmic function fit to the survey results. Extended Data Tables
Extended Data Table 1: 3D model parameters (80 KB)
|
|
 スパムメールの中から見つけ出すためにメールのタイトルには必ず「阿修羅さんへ」と記述してください。